Initiatives for Biodiversity
The Group’s Basic Environmental Management Policy and the Mid-term Environmental Management Policy stipulate that business activities must consider biodiversity and ecosystem services. The Group has established the Basic Biodiversity Principles and Action Guidelines based on these policies. When this was established, the Group surveyed its initiatives on biodiversity, the use of natural resources, and status of efforts to comply with the Cartagena Protocol both inside and outside of Japan. Additionally, the Group assessed the relationship between its business activities and biodiversity and identified issues through an analysis of the Group’s risks and opportunities. (Please refer to the diagram “Map of corporate activities and biodiversity” below.)
The Daiichi Sankyo Group believes that biodiversity conservation and sustainable use of ecosystem services are essential in performing business. We promote raising awareness and understanding of employees, as well as the strengthening of environmental conservation activities in collaboration with business partners and private groups, to procure materials with less environmental burden, and to socially contribute towards biodiversity conservation.
Basic Biodiversity Principles and Action Guidelines
Basic Policy
- Our Basic Environmental Management Policy states that, “Safeguarding the environment is the bedrock of all Group operational management.” We have
therefore acted to prevent pollution and global warming and contribute to recycling. Through our initiatives, we have used biological resources properly to
minimize the impacts of our operations on biodiversity and have sustainably reduced chemical and other discharges.
- We will continue striving to preserve biodiversity and respect the principles of the Convention on Biological Diversity by adhering to the following
Biodiversity Action Guidelines, thereby enhancing social sustainability.
Action Guidance
1.
Actively promote to address biodiversity conservation in all business activity |
- Under take ongoing endeavors to avoid or reduce operational impacts on biodiversity, devoting particular attention to lowering the environmental impacts of air and water emissions and wastes.
|
2.
Identify the biodiversity impacts of ecosystem services, using those services sustainably |
- Recognize the operational importance of ecosystem services while understanding and minimizing their impacts on biodiversity, using those services sustainably.
|
3.
Use genetically modified organisms responsibly |
- Maintain biosafety by continuing to responsibly use genetically modified organisms in drug discovery and production in keeping with the Cartagena Protocol on Biosafety and national laws and ordinances.
|
4.
Access to Genetic Resources and the Fair and Equitable Sharing of Benefits Arising from their Utilization |
- Comply with the Convention on Biological Diversity, the Bonn Guidelines, and other relevant rules to access and utilize genetic resources of the provider countries appropriately and to share benefits arising from their utilization in a fair and equitable manner.
|
5.
Communicate with stakeholders and improve in-house awareness |
- Foster biodiversity preservation by communicating and liaising better with public and private entities.
- Educate employees to better understand how operations affect biodiversity and encourage internal and external efforts to safeguard biodiversity.
|
Map of Corporate Activities and Biodiversity

An enlargeable image opens in a separate window
TNFD Disclosure
The Daiichi Sankyo Group believes that the conservation of biodiversity and the sustainable use of ecosystem services are essential in performing business. We therefore promote biodiversity initiatives to achieve the Nature Positive*1.
We agree with the TNFD*2 recommendations and registered as a TNFD Adopters*3 in May 2024. In FY2024, we have completed an assessment based on the LEAP approach*4 in line with the TNFD recommendations. In FY2025, we also conducted a nature-related scenario analysis to assess critical nature-related risks in greater detail.
*1Nature Positive is a global societal goal defined as ‘Halt and reverse nature loss by 2030 on a 2020 baseline, and achieve full recovery by 2050 for the benefit of people and planet.
*2TNFD(Taskforce on Nature-related Financial Disclosures) is a market-led, science-based and government-supported global initiative. The recommendations and guidance provide organizations with a risk management and disclosure framework to act on evolving nature-related dependencies, impacts, risks, and opportunities. They are designed to provide decision-useful information to capital providers and other stakeholders.
*3TNFD Adopters are organizations that have committed to start making disclosures aligned with the TNFD Recommendations in their corporate reporting for their fiscal years 2023, 2024 or 2025.
*4The LEAP (Locate, Evaluate, Assess and Prepare) approach is an integrated approach developed by TNFD to identify and assess nature-related issues. It comprises four phases: Locate interfaces with nature; Evaluate dependencies and impacts on nature; Assess nature-related risks and opportunities; and prepare to respond to those risks and opportunities and to disclose material nature-related issues.
Governance
The Daiichi Sankyo Group has established the Sustainability Committee to effectively identify and respond to changes in the external environment, including evolving social issues and societal conditions, and to promote sustainability management by integrating business activities with efforts to address these challenges. The Sustainability Committee is chaired by the Head of Global Corporate Affairs and comprises leaders from individual business units and corporate functions. The Committee meets, in principle, twice a year to discuss strategies and policies related to human rights; environmental, health, and safety (EHS); sustainability information disclosure; and social contributions. With respect to EHS, the Committee deliberates on, oversees, and reports on EHS management policies, set targets, and related activities. EHS-related results are reported to the Executive Management Committee (EMC), and matters of particular importance are subsequently reported to the Board of Directors.
Corporate Governance Code
Environmental Management Promotion System
The Daiichi Sankyo Group has established EHS Policy and has implemented EHS initiatives based on the recognition that protecting the environment and ensuring the health and safety of our employees across all corporate activities are key management priorities. In addition, our Biodiversity Basic Policy and Action Guidelines stipulate commitments to the following: “Access to Genetic Resources and the Fair and Equitable Sharing of Benefits Arising from their Utilization” and “Communicate with stakeholders and improve in-house awareness”. Furthermore, the Daiichi Sankyo Group Human Rights Policy declares
As a signatory to the United Nations Global Compact, the Group supports its 10 principles in the four areas of human rights, labor, environment, and anti-corruption.
Daiichi Sankyo Group EHS Policy
Biodiversity Basic Policy and Action Guidelines
Daiichi Sankyo Group Human Rights Policy
Risk & impact management
Process for Identifying, Assessing and Prioritizing Nature-related Dependencies, Impacts, Risks and Opportunities
We identified and assessed our dependencies on and impacts on nature, as well as nature-related risks and opportunities, through the following process. To understand nature-related issues across our value chain, we assessed dependencies and impacts in the pharmaceutical sector and in upstream and downstream sectors of our value chain using the ENCORE risk assessment tool.
In FY2024, we developed a materiality map of nature-related challenges from the perspectives of the depth of connection with the pharmaceutical sector and our business activities, and identified material issues related to its dependencies on and impacts on nature across relevant sectors. In FY 2025, we assessed the materiality of nature-related risks with potential future impacts on its business by conducting scenario analyses based on actual business risks associated with the identified material issues.
We also conducted a location-based assessment for each material issue using risk assessment tools to evaluate the likelihood of these risks occurring across our business locations. Based on the assessment results, we identified priority locations for reviewing our business initiatives. Additional targets and measures are currently being discussed through dialogue with internal stakeholders. The assessment results are disclosed in the Strategy section.
Identification & Assessment Process for Nature-Related Dependencies, Impacts, Risks, and Opportunities

Processes for Managing Nature-related Dependencies, Impacts, Risks, and Opportunities / Overall Risk Management Processes
The Sustainability Committee plays an important role in assessing the nature-related risks and opportunities, including climate change, evaluating their potential impacts on the Group’s business, and managing them to enhance our resilience. The Committee considers countermeasures against risks that may necessitate changes to our business activities, such as climate change- and water-related risks. It also reports significant risk-related matters to EMC and then the Board of Directors, where they are incorporated into our Group’s comprehensive risk management framework. In addition, the Committee deliberates on and approves medium- and short-term targets and implementation plans aimed at achieving long-term carbon neutrality and the Nature Positive goals.
Strategy
Nature-related business risks have already materialized worldwide. In light of their severity, we recognize these risks as critical risk management issues that must be addressed in the pharmaceutical sector, one of our core business areas. With a focus on identifying nature-related risks that attract stakeholder attention and are closely associated with our business, we conducted an analysis in line with the LEAP approach in FY2024, followed by a nature-related scenario analysis in FY2025.
- Nature-Related Scenario Analysis
Prior to the risk assessment, we conducted a nature-related scenario analysis focusing on environmental conditions and market trends. The TNFD recommendations on Scenario Analysis recommends the use of a 2×2 matrix consisting of two axes: nature capital and ecosystem service degradation (x-axis) and the alignment of market and non-market forces (y-axis). This analysis comprehensively assessed the risk level and likelihood of potential future threats and evaluated the probability of risk occurrence and our financial strength for 25 identified business risks, based on the two defined scenarios: Scenario 1 (Nature Positive, or NP) and Scenario 3 (Business as Usual, or BaU).
In Scenario 1 (NP), heightened environmental awareness reflected in laws and regulations, as well as among stakeholders, leads to increased transition risks such as response costs and litigation, reputational damage stemming from incidents that cause environmental harm or pollution. In Scenario 3 (BaU), limited growth in environmental awareness and regulating services, continued environmental degradation lead to the rapid deterioration of ecosystem services. This, in turn, increases the risk of natural disasters such as droughts and floods, as well as physical risks, including disruptions to raw material procurement infrastructure that threaten the continuity of manufacturing operations.
We organized the pathways through which changes in external environment such as social and natural factors, give rise to risks with potential business impacts, which subsequently materialize and ultimately result in negative financial impacts, into logic models for each risk factor. In this manner, we have identified risks to be evaluated. The materiality of each risk to the Group was assessed under the worst-case scenario, in which financial impacts of each risk are maximized.
Four-Scenario Matrix

Source: Guidance on scenario analysis (TNFD)
- Identification of nature-related dependencies and impacts
Our material nature-related risks are divided into four areas: water resources, pollution, natural resources, and ecosystems. We identified a total of 25 business risks across these categories and assessed their materiality. The table below presents the risks that were determined to have a certain level of materiality based on the above assessment. These risks are further classified into upstream risks within our value chain, which relate to raw material production and processing, and direct operational risks associated with pharmaceutical product manufacturing and R&D.
The risk materiality assessment was conducted based on the two scenario: the Nature Positive scenario (NP), which represents the worst-case scenario for transition risks, and the Business as Usual scenario (BaU), which represents the worst-case scenario for physical risks. The assessment evaluated our financial strength and the probability of risk occurrence in line with the TNFD guidelines. During the risk assessment process, the results were reviewed and discussed in collaboration with responsible members from the relevant organizations.
Upstream Risks in the Value Chain
*The risks presented in the table are excerpts of those assessed as material from the perspective of impact severity on the Group. Risk materiality was assessed under two scenarios, based on the financial strength and the probability of risk occurrence, in line with the TNFD guidelines, and was evaluated using the worst-case scenarios with more severity on the Group.
Direct Operational Risks
*The risks presented in the table are excerpts of those assessed as material from the perspective of impact severity on the Group. Risk materiality was assessed under two scenarios, based on the financial strength and the probability of risk occurrence, in line with the TNFD guidelines, and was evaluated using the worst-case scenarios with more severity on the Group. Risks associated with our outsourced manufacturers are classified as direct operational risks.
- Consideration of Risk Mitigation Measures
Examples of the Group's initiatives to address material risks are presented below. Additional goals for each material issue, also covering the supply chain, as well as the implementation of concrete measures, will be determined based on gap analysis between external expectations and our current initiatives, as well as dialogue with relevant stakeholders.
Examples of the Group's Initiatives to Address Material Issues
- Analysis Details (Analysis in line with the LEAP approaches)
In FY2024, an analysis conducted in line with the LEAP approaches identified material nature-related issues across our value chain in terms of dependencies and impacts on nature, and assessed the locations and operational sites within our value chain where such issues could manifest. Five major raw materials within our upstream supply chain were selected as targets for the risk case survey and location-based analysis based on the criteria that they are used in the Group’s main products (approximately 61% of FY2023 sales coverage) and are listed on the SBTN High Impact Commodity List. Accordingly, we understand there remains room for improvement in terms of the scope of coverage and analytical accuracy.
We focus on mitigating nature-related risks through our business operations at the identified locations and operational sites by implementing concrete measures to address identified material issues, while also enhancing our resilience by expanding business opportunities.
(1) Identification of Nature-related Dependencies and Impacts
Nature-related dependencies and impacts across our value chain were assessed using the ENCORE nature risk assessment tool, and the results were visualized in a heat map.
Risk Assessment Results by Sector Across Our Value Chain (Dependencies on Nature)*
*The table presents the assessment results of nature-related dependencies by sector across our value chain using the ENCORE nature risk assessment tool.
Risk Assessment Results by Sector Across Our Value Chain (Impacts on Nature)*
*The table presents the assessment results of nature-related impacts by sector across our value chain using the ENCORE nature risk assessment tool.
(2) Evaluation of Material Issues
We assessed the short-, medium-, and long-term depth of our business relationships for the identified nature-related risk cases across relevant sectors, where significant dependencies on, and impacts on, nature may arise, based on the severity of each case. Following this assessment, we created a nature-related materiality map consisting of two axes: relevance to the pharmaceutical sector (y-axis) derived from the ENCORE assessment results, and relevance to our business (x-axis) derived from the risk case research results. As a result, we identified six material issues for the Group: “water use”, “natural resource use”, “water depletion”, “water pollution”, “soil pollution”, and “impacts on local ecosystems”. From the perspective of the characteristics of each risk and the consistency of counter measures, these six material issues are divided into four areas: water resources, pollution, natural resources, and ecosystems. For the risk assessment results, please refer to “2. Identification of Material Nature-related Risks”.
Nature-related Materiality Maps: Dependencies (Left) and Impacts (Right)

(3) Location-based Analysis across the Value Chain
We conducted a location-based analysis* covering both our direct operations and the upstream value chain on nature-related issues in three areas —water resources, pollution, and ecosystems—using risk assessment tools, to evaluate the likelihood of physical risk materialization across our business regions, focusing on risks that are both measurable using assessment tools and of a certain level of materiality. As a result, eight of the Group’s direct operational sites were identified as our critical bases.
For the upstream portion of the value chain, risk analyses were conducted on five key raw materials at their main production sites and locations with potential nature-related issues were identified for all of these raw materials.
*The assessment indicators included water stress, water pollution index, presence or absence of mangroves and coral reefs, conflict cases, protected areas and areas undergoing deforestation, and presence or absence of peatlands. The assessment tools used were Global Forest Watch, IBAT, Environmental Justice Atlas, Crop Production Maps, Global Wetlands, Global Dam Watch, WWF Water Risk Filter, Aqueduct, and Ocean+ Habitat.
Analysis Process for Water Resource (Direct Operational Areas)

Analysis Process for Pollution and Ecosystems (Direct Operational Areas)

Location-based Analysis Results (Direct Operational Areas)
● High-risk area
Metrics & targets
Quantitative Metrics
Quantitative environment-related data is disclosed in ESG Data. We plan to consider the disclosure of core metrics following further data collection and more detailed analyses.
Quantitative Targets
The Group aims to achieve its environmental targets in order to contribute to the achievement of Nature Positive goals. Our quantitative environmental targets are disclosed in Promoting Environmental Management. In the future, we plan to consider the need to set additional targets in line with TNFD recommendations.
Future Plans
The Group plans to set targets for material issues, consider a medium-term action plan, and further enhance analytical methods.
Ecological Footprint
We assess the ecological footprint (EF), an indicator of biodiversity, jointly with experts from the NGO Global Footprint Network, to examine all environmental burdens in the business activities of Group companies in Japan. The assessed EF is used as a comprehensive indicator of environmental burdens, including those related to biodiversity, by reviewing and monitoring long-term changes in the relationship between the reduction of environmental burdens and biodiversity conservation (trade-off) in the Group.
This initiative has been recognized as an action for achieving the Aichi Target (20 targets) that was adopted at COP10 (the 10th Meeting of the Conference of the Parties to the Convention on Biological Diversity in Nagoya) and has been registered on the Nijyu-Maru Project as well. In addition, it was introduced as an example of monitoring biodiversity in the Guidelines for Private Sector Engagement in Biodiversity (Second Edition) issued by the Ministry of the Environment of Japan.
Initiatives for Biodiversity Conservation
Conservation for rare species of plants
To preserve the golden orchid (designated as critically endangered Type II in the Japanese Ministry of the Environment’s Red Data Book) and the silver orchid, we have prohibited entry into the forested area of the property at the Tatebayashi Biopharmaceuticals Center where the plant naturally grows (approximately 1,000 m2). The continued conservation effort has been resulted in an increase in the population of the species and expansion of breeding range.
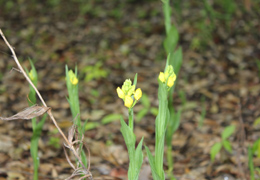
Golden orchid
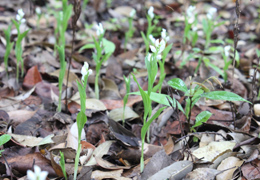
Silver orchid
Greening in harmony with the surrounding environment
The Kitamoto Office of Daiichi Sankyo Biotech Co., Ltd. engages in environmental conservation that considers the surrounding natural environment and ecosystem and implements sound insulation and greening in harmony with the neighboring Kitamoto Nature Observation Park.
Recognized for its various diversity-friendly initiatives, the office was given the 7th Sainokuni Green Plan Award in 2015. The award is granted by Saitama Prefecture to facilities that have achieved excellent greening and sound maintenance.
The office continues to engage in environmental conservation through greening and other ecosystem protection measures.
Activities to nurture biodiversity
In recent years, the population of pollinators such as honey bees and butterflies has been on a decreasing trend around the world due to the effects of deforestation, agricultural chemicals, global warming, and other issues. At our Pfaffenhofen Plant in Germany, we cooperate with Pfaffenhofen in Bloom -an initiative started by the city of Pfaffenhofen aimed to increase the pollinator population- and we are actively working on encouragement of biodiversity on the plant premises. We are planting many flowers in the approximately 3,200 m2 area as an environment where honeybees and other insects can inhabit. In addition, in April of 2022, Daiichi Sankyo Europe (Munich, Germany), one of our overseas group companies, started planting one tree per every new IT device, and approximately200 trees had already been planted. To promote this initiative, the company has secured enough land in Germany to plant approximately 3,000 trees, thereby working on achieving the Sustainability IT.
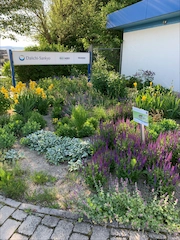
Planting in the premises
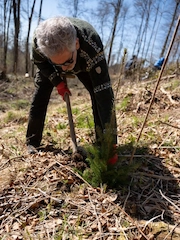
Afforestation through sustainable IT
Participation in 30by30 Alliance for Biodiversity
The Daiichi Sankyo group participates in 30by30 Alliance for Biodiversity launched in April 2022 by the Ministry of the Environment of Japan. 30by30 is a goal that aims to conserve or protect at least 30% of land and sea by 2030, thereby contributing to the conservation of biodiversity. We will promote initiatives to contribute to 30by30, including the implementation of e-learning programs to raise employee awareness and understanding of biodiversity and the setting of targets for biodiversity conservation.
Participation in Keidanren Initiative for Biodiversity Conservation
The Daiichi Sankyo group has endorsed the "Keidanren Declaration for Biodiversity and Guideline*5" advocated by the Japan Business Federation and the Keidanren Committee on Nature Conservation, and have participated in the " Keidanren Initiative for Biodiversity Conservation*6" We will promote initiatives to contribute to transitioning nature positive world, including the analysis and disclosure in line with TNFD recommendations and the setting of targets for biodiversity conservation, the initiatives to contribute to 30by30, the implementation of programs to raise employee awareness and understanding of biodiversity.
*5Keidanren Declaration for Biodiversity and Guideline
https://www.keidanren.or.jp/en/policy/2023/082_proposal.html
*6Keidanren Initiative for Biodiversity Conservation
https://www.keidanren-biodiversity.jp/logo_en.php